Adapt or Drift: Resilience Engineering When AI Moves the Operating Point

Andrew Hatch
The Blocker Lemming represents deliberate safety intervention: pause or redirect work to preserve margin.
Session: Adapt or Drift: Resilience Engineering When AI Moves the Operating Point.
WHOAMI




- Tester
- Lead Tester
- Business Analyst
- Developer
- Lead Developer
- Technical Architect
- Software Engineering
- SharePoint Developer
- Solution Architect / Solutions Architect
- .NET Technical Architect
- Integration Consultant
- Integration Architect
- SharePoint 2007 Consultant
- BizTalk Server Consultant
- .NET Architecture Consultant
- TFS Configuration Management Lead
- ERP Integration Team Lead
- Microsoft Office Solution Consultant
- Configuration Management Lead
- Solution Architect – Information Management and Portal
- Solution Architect – .NET Web Application
- DevOps Engineer
- Data Migration
- Web Development
- DevOps Architect
- .NET Developer
- Senior IT Consultant
- Head of Platform Engineering
SWE/SRE Engineering Manager 15 years.




@hatchman76
Introduce your background:
- Australia and the United States.
- Cisco ThousandEyes. SWE/SRE Engineering Manager, 15 years.
- AWS and data centres.
- LinkedIn.
- Medium and Bluesky: @hatchman76.
Some recurring characters


Anything AI!
LLM, Agent etc...
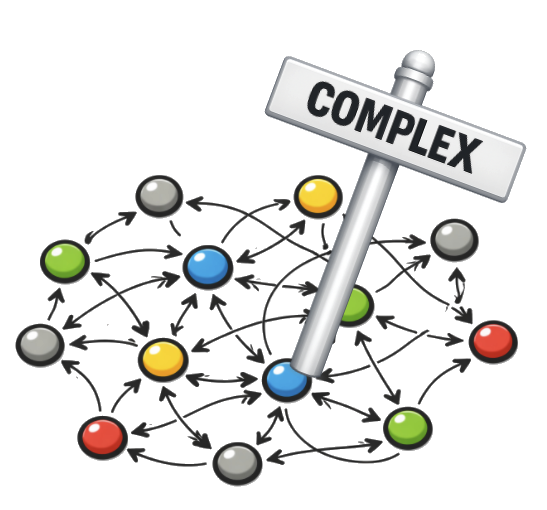
any complex distributed
software system.
Introduce the recurring images as visual shorthand the audience will see throughout the talk and should keep in mind. The AI image includes LLMs, agents and related tools. The complex-system image represents a complex distributed software system, of which those tools are a part.
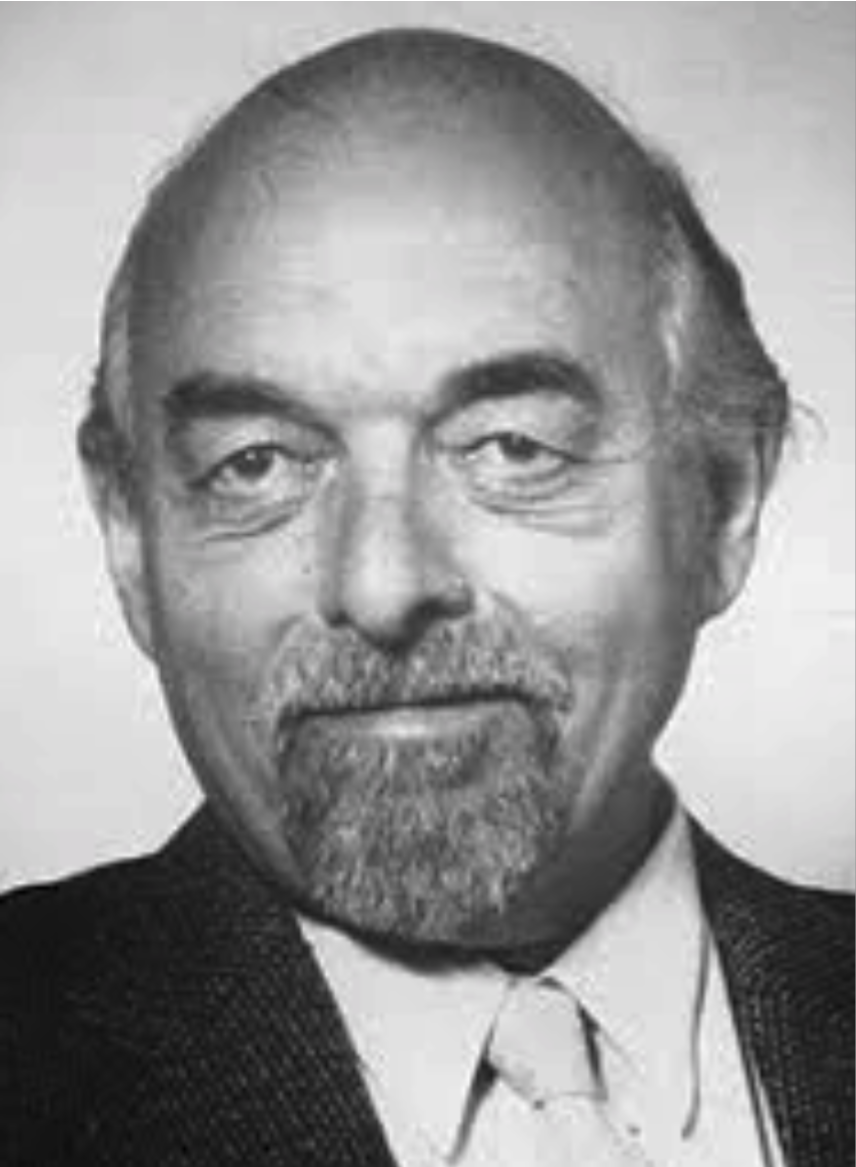
Jens Rasmussen
Human Factors and Safety Science
Risk Management in a Dynamic Society (1997)



Socio-Technical Systems
- Hierarchical
- Multi-disciplinary
Systems Thinking
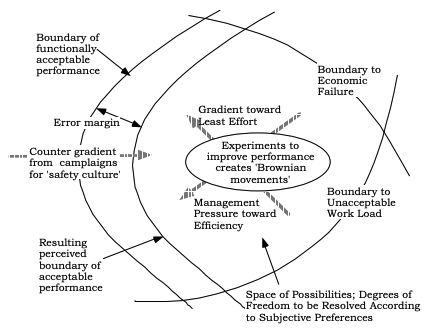
Introduce Jens Rasmussen and the 1997 model. The next slide maps the wider research landscape around Figure 3, and the slide after that locates people and technology within Rasmussen’s social control hierarchy before the boundary model is translated into plain language.
- The original model comes from Risk Management in a Dynamic Society (1997).
- Examples of safety-critical domains include radiological safety, maritime safety and healthcare.
- Socio-technical systems are hierarchical and multidisciplinary.
- Systems thinking connects these levels and disciplines.
Paper: Rasmussen, Risk Management in a Dynamic Society (1997).
The research behind the model
The 31-page paper connects decades of studies across engineering and the human sciences.
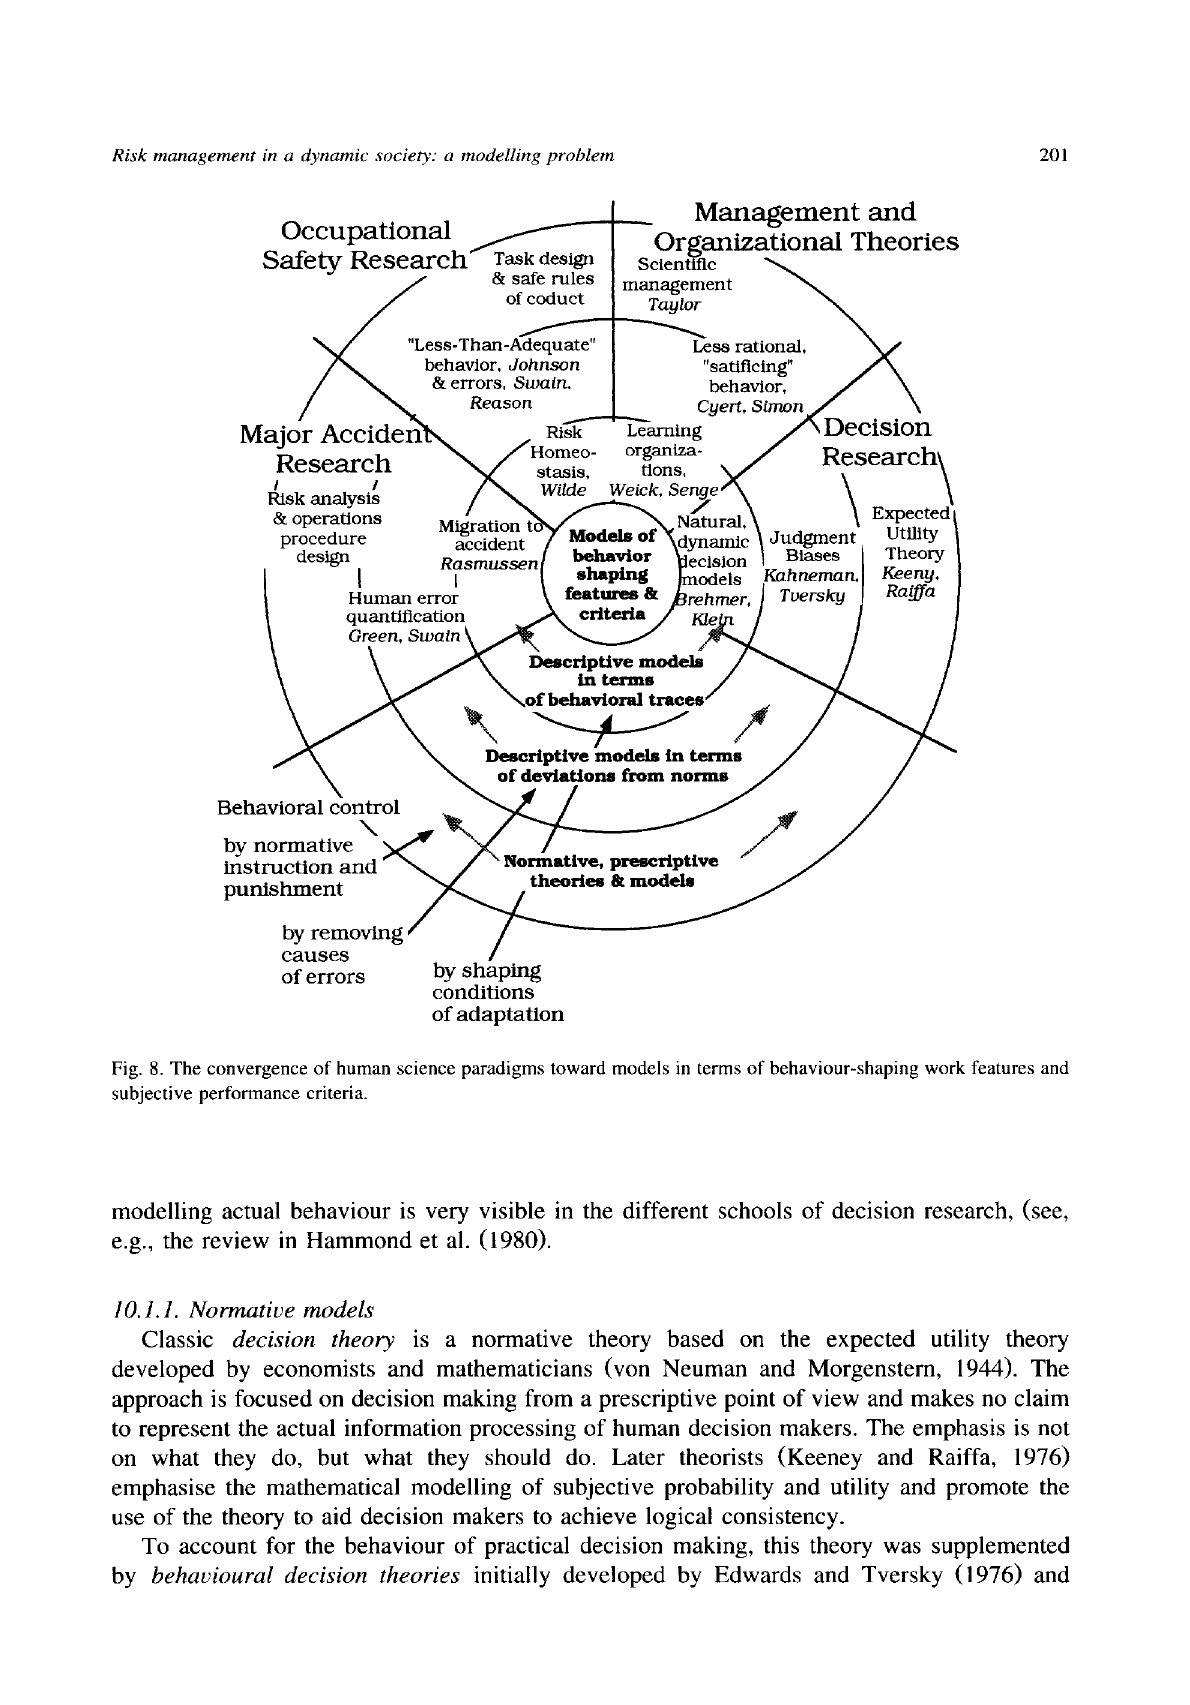
Risk analysis Different hazards require different strategies
Defence in depth Redundant layers can erode without visible failure
Human performance under pressure Studies move from error rates to work in context
Feedback control Controllers need current state, authority, and competence
Naturalistic decisions Local adaptations interact across the system
This is a synthesis paper rather than a single empirical validation of the model.
- Rasmussen distinguishes empirical, evolutionary, and analytical risk strategies.
- Defence in depth matters, but redundant protections can degrade quietly because a local violation may have no immediate visible effect.
- The paper reviews human reliability, operator modelling, field evidence, and organisational research. Its direction of travel is away from isolated error counts and toward behaviour in a real work context shaped by workload, time, cost, and competing goals.
- Risk management becomes a feedback-control problem spanning the whole socio-technical hierarchy.
- Decisions are embedded in continuous work. Locally sensible adaptations can interact across controllers and create system-level risk.
The next slide makes the paper’s system-wide control hierarchy concrete, and the following slide simplifies the geometry without discarding these mechanisms.
Source: Rasmussen, Risk Management in a Dynamic Society (1997), pp. 183–213.
- Figure 8 and research convergence: p. 201.
- Risk strategies: pp. 197–200.
- Defence in depth: pp. 189–190, 198–199, 207–209.
- Human and organisational adaptation under pressure: pp. 186–190, 193–196, 206–209.
- Feedback control: pp. 183–186, 192–197.
- Naturalistic decision making: pp. 186–190, 200–206.
Where does control live?
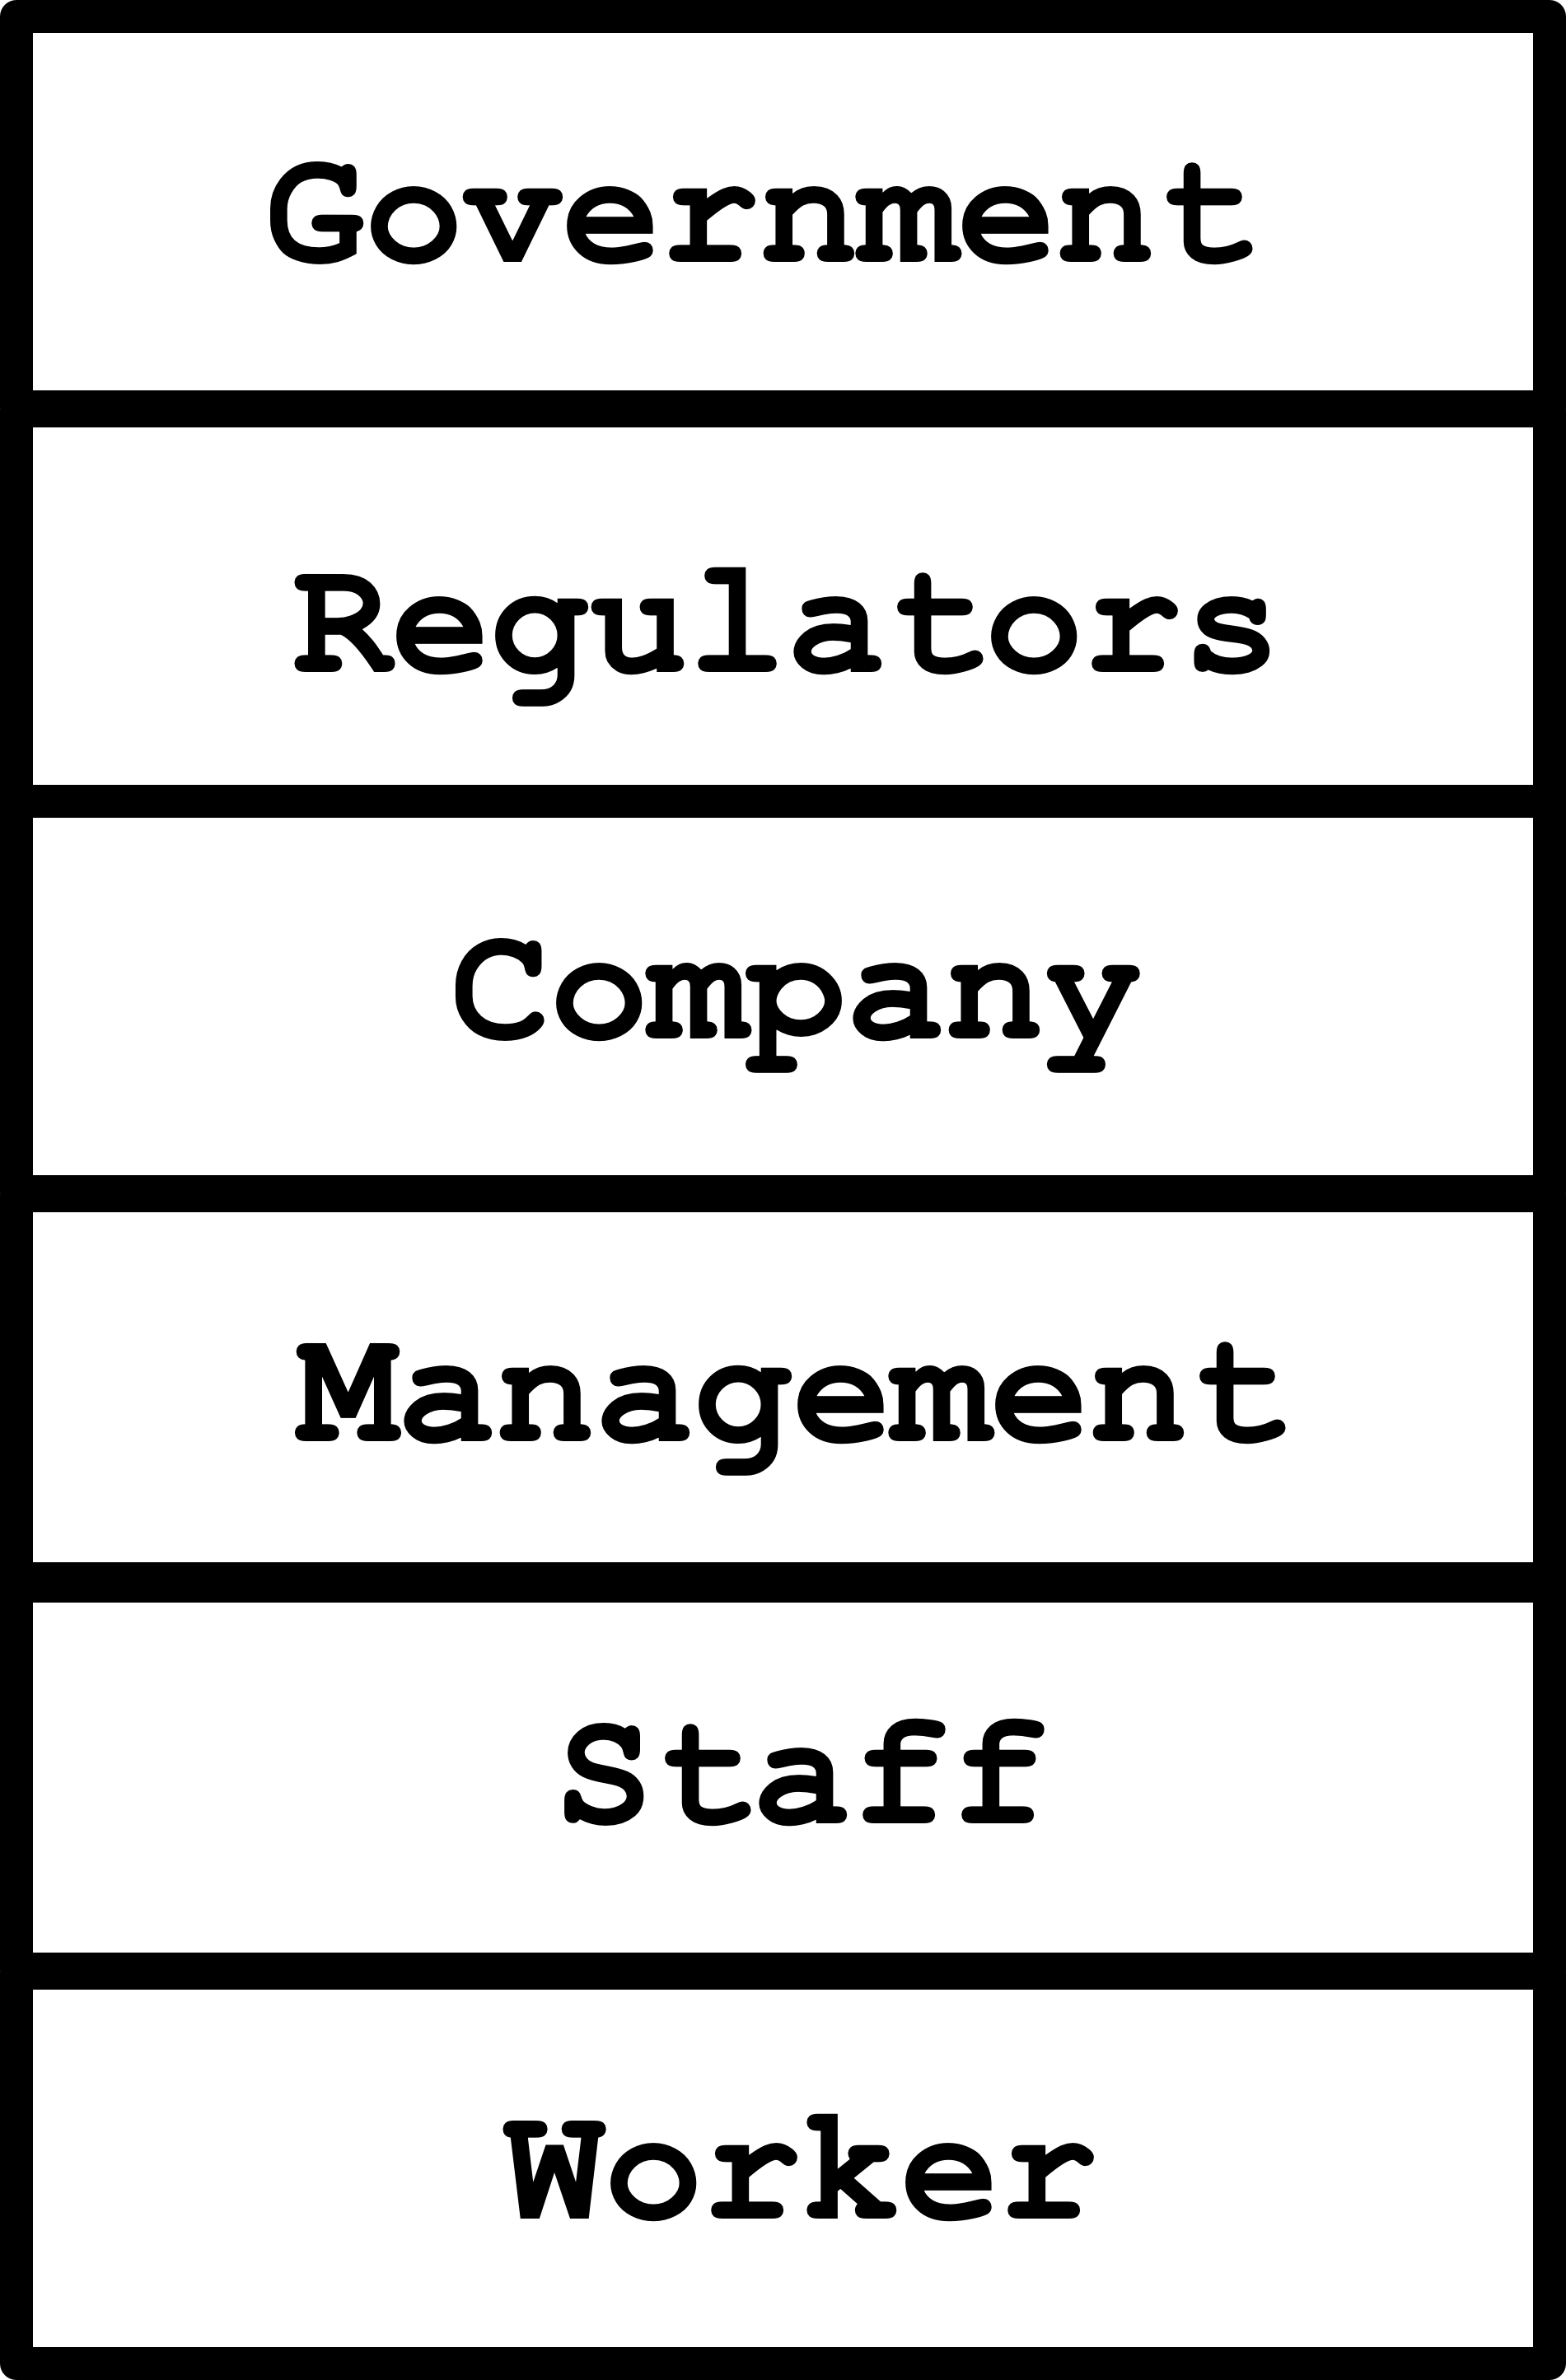
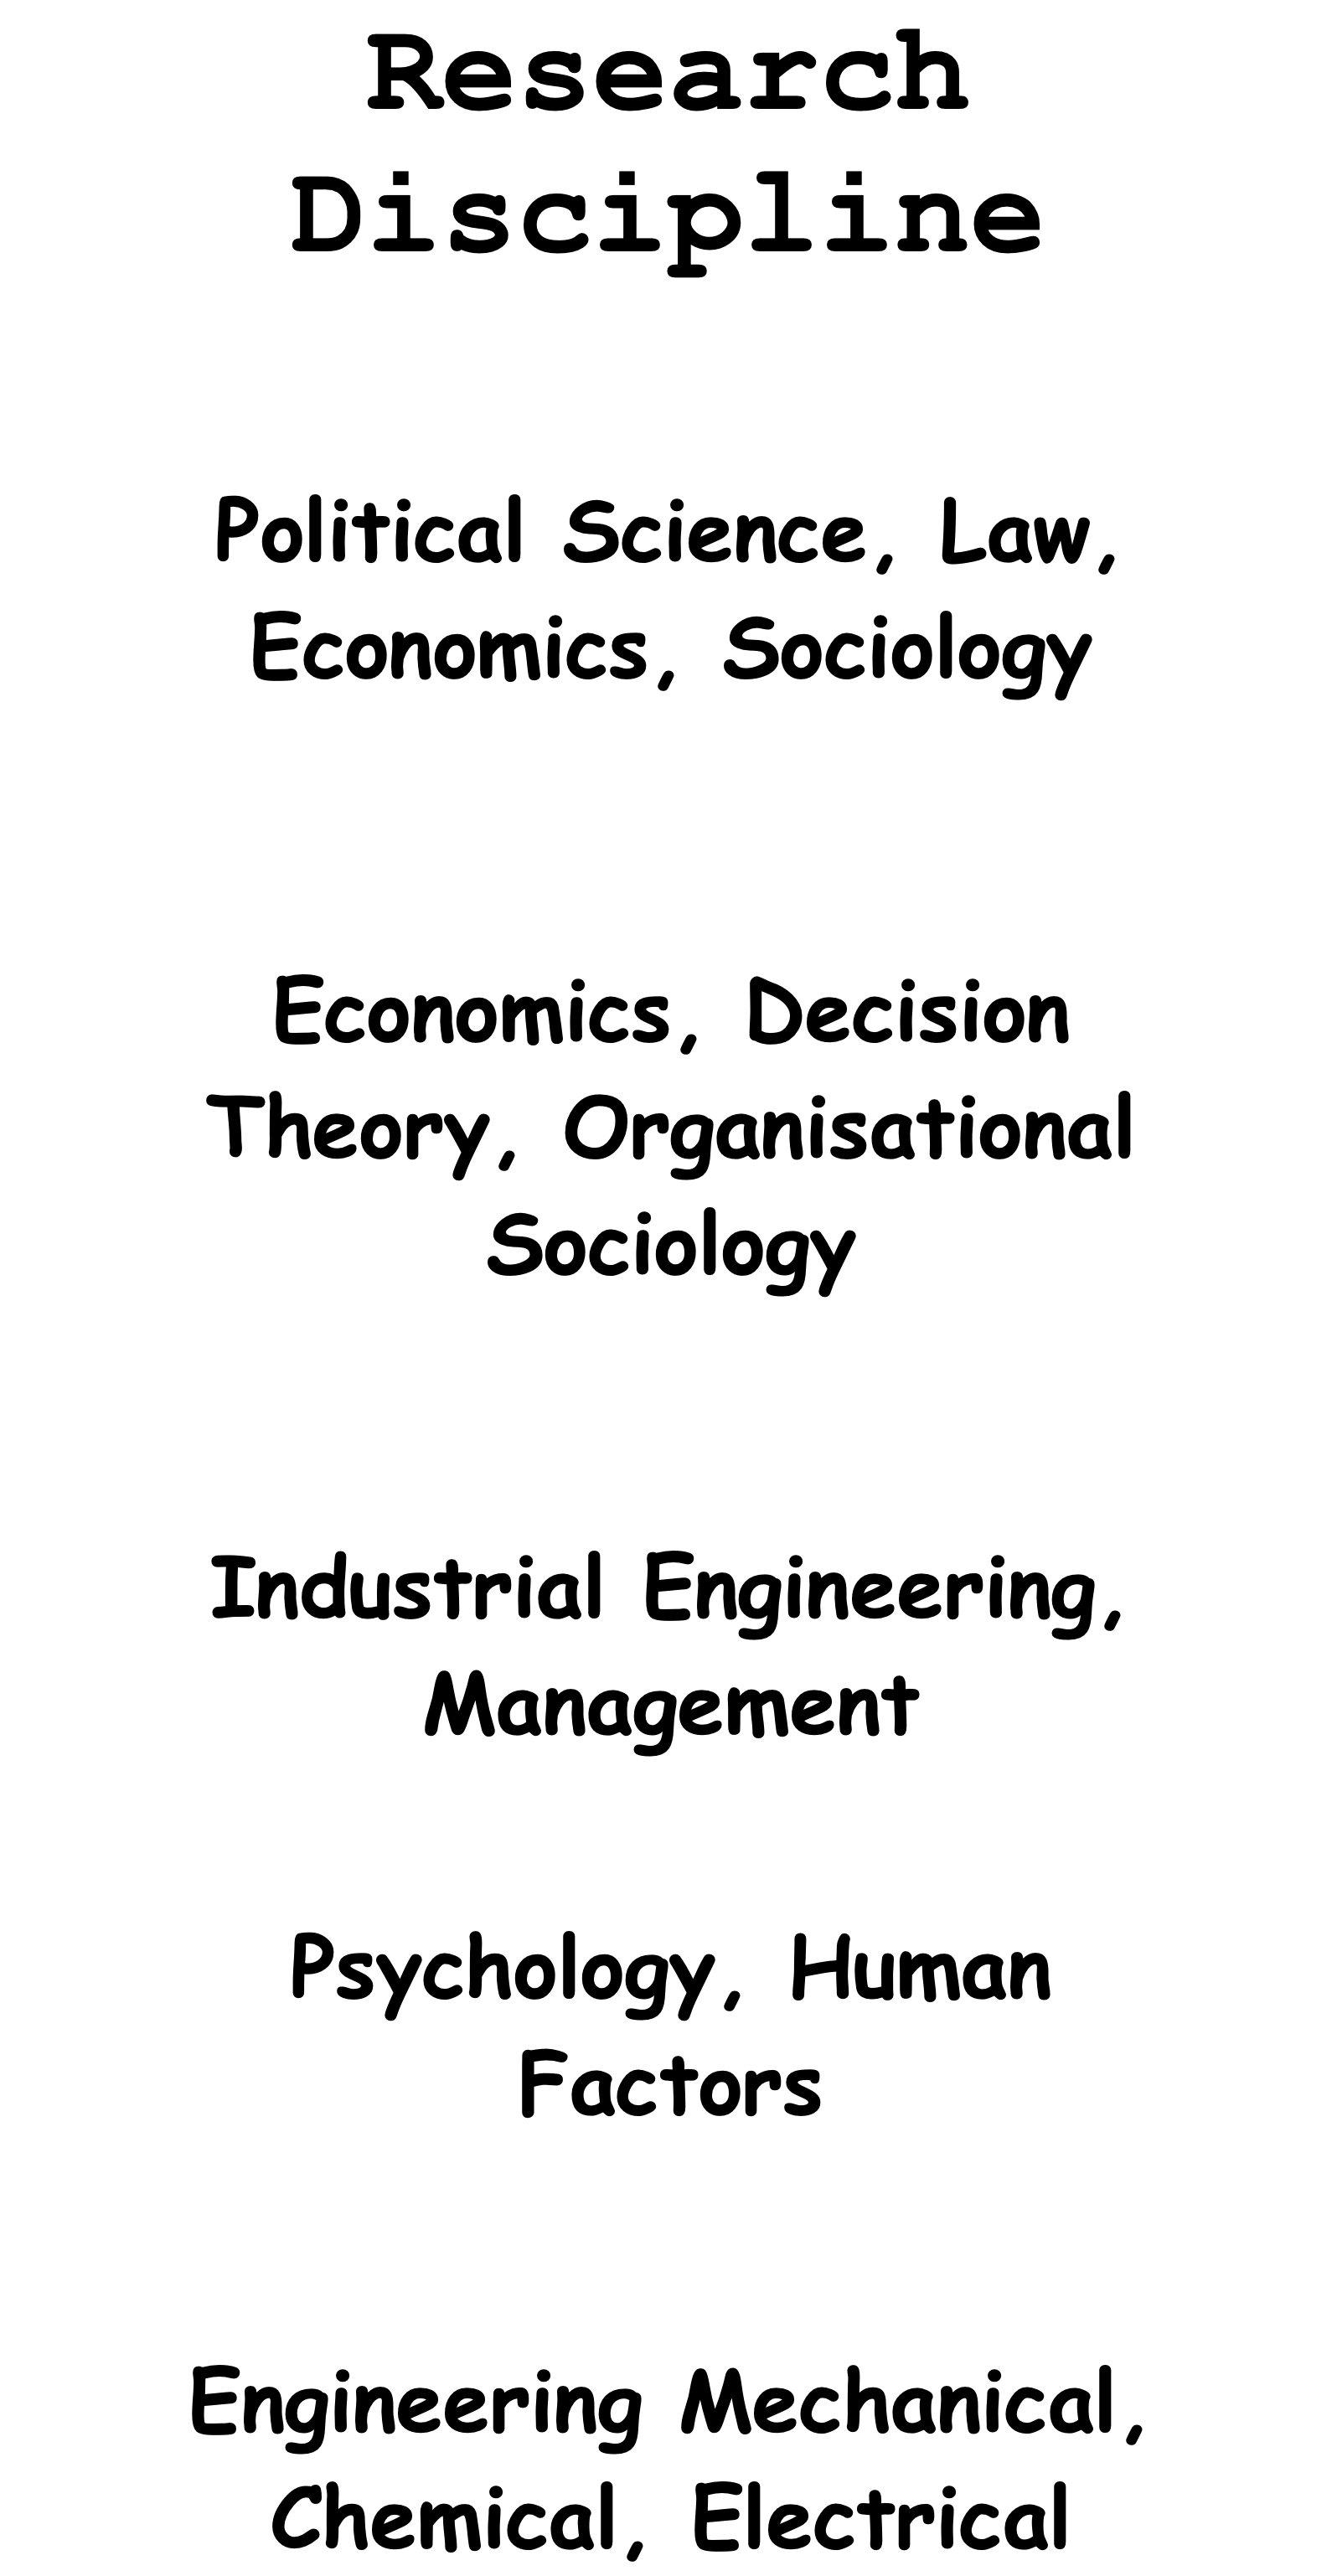
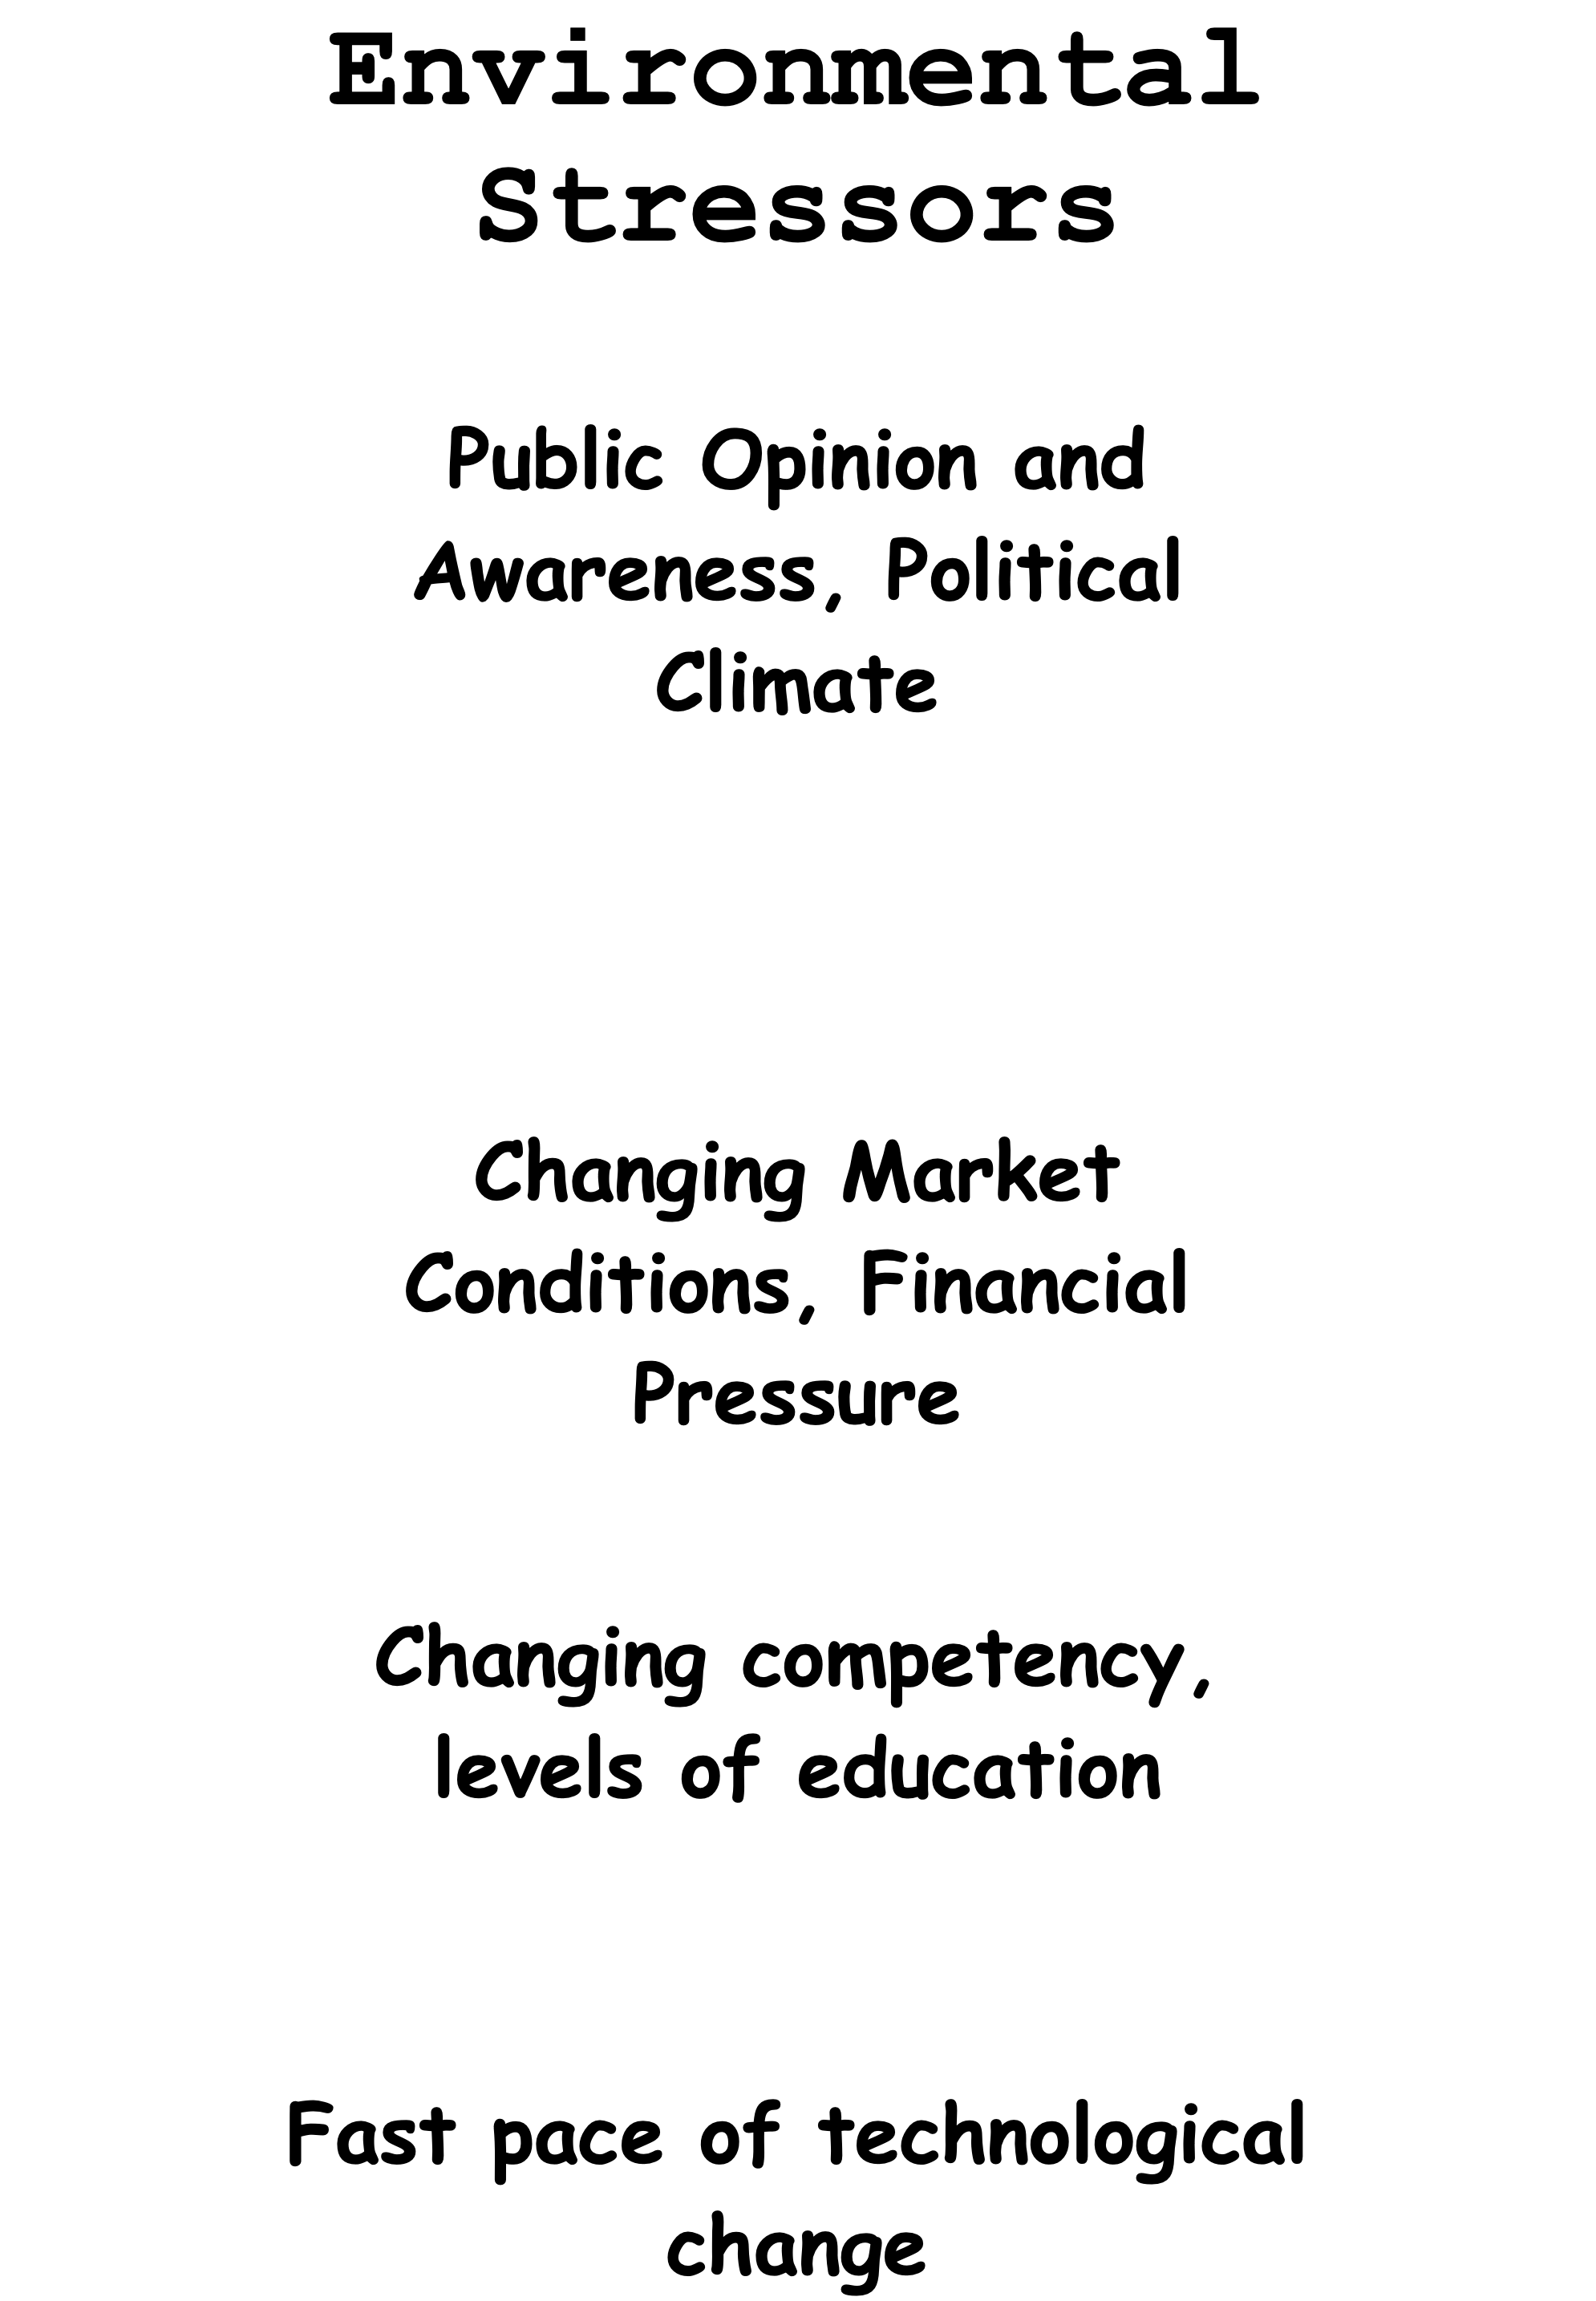
The social control hierarchy surrounds the people and technology doing the work. Research disciplines and environmental stressors cross its levels.
Control is distributed rather than owned by any single actor, and information must travel upward while decisions and constraints travel downward. Each layer adapts on a different timescale.
Goals, evidence and authority
The control structure is the distributed network of decision makers, goals, constraints, information, competence and authority around the work. Observations and outcomes inform decisions, and decisions and constraints change the work. Feedback must reach actors with the resources and authority to respond.
When AI enters these channels, re-examine problem framing, attention, verification, skill retention under pressure, communicated intent and feedback fidelity across the hierarchy. Task-level studies do not establish the accumulated effects on a whole socio-technical system.
Source: Rasmussen (1997), Figures 1 and 3, control, adaptation and information.
Putting it together


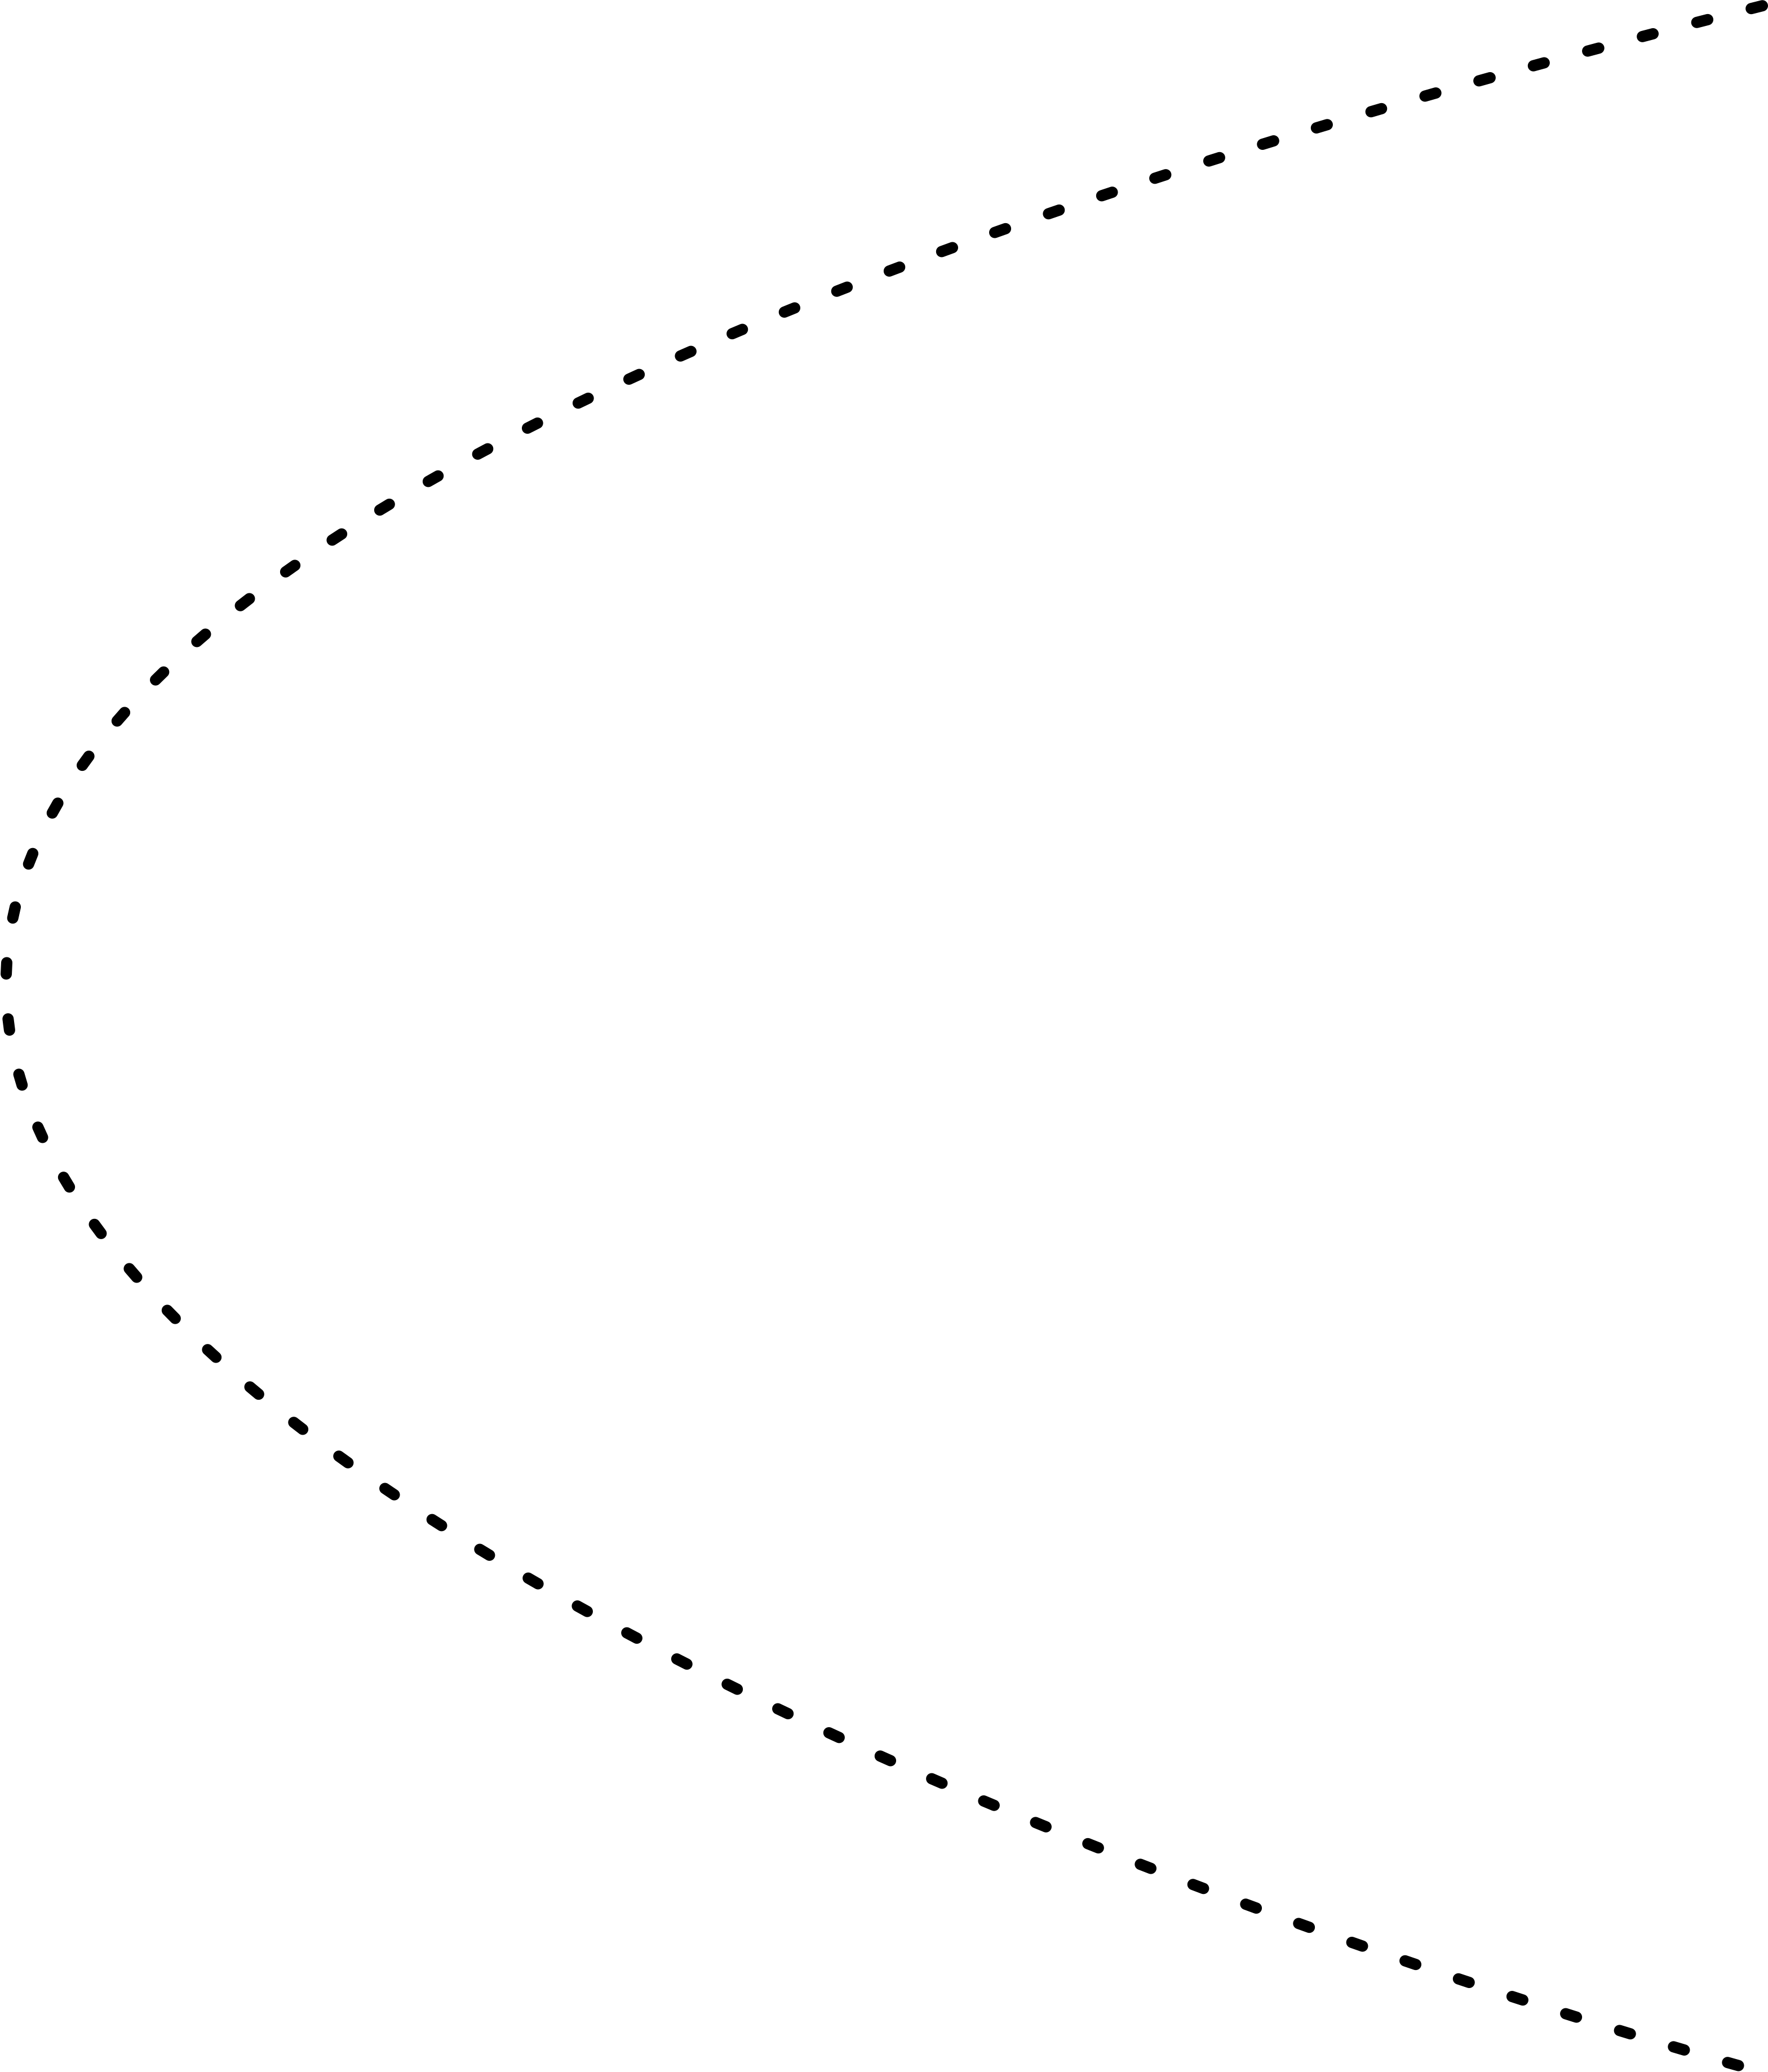
The hierarchy on the previous slide surrounds the people and interactions in this complex system. People and technology operate within economic, workload and performance constraints. The dotted error margin marks a buffer inside the performance boundary.
The following slide explains the boundaries and the margin in detail.
Adaptation with LLM tools
Tools change the conditions in which people work, and repeated adaptations change workflows, expectations and later decisions. Rasmussen remains a framework for examining these effects. Measures of human performance, learning, coordination and control need revalidation in LLM-mediated work. This does not make earlier human-factors research obsolete.
Source: Rasmussen (1997), Figures 1 and 3, control, adaptation and information.
Boundary to economic failure
Boundary to unacceptable workload
Boundary of functionally acceptable performance
Error Margin

Plain-language script
“The economic boundary marks where we can no longer pay the bills. The workload boundary marks where people cannot keep going. The performance boundary marks where the system can no longer do its job acceptably or safely. We cannot see that line exactly, so the dotted line gives us a margin for error.
This dot is not a person. It is the whole system — people, software, and rules — working right now. The dim dot marks the starting reference position, not a second current operating state. The shaded area is the playing surface, with the error margin shown in orange.
Economic and workload limits can change as financial and human capacity change. Inward shifts reduce the playing surface; outward shifts expand it.
Pressure for efficiency and less effort can draw normal adaptations, and the whole system's operating state, toward the performance boundary.
The charts stand for pressure to reduce cost, which a downturn can intensify. The hands stand for ways people reduce effort under workload; the Blocker Lemmings show safety action near the error margin: pause or redirect work to preserve margin. Rasmussen describes actors adapting within the work-space, encountering an effort gradient while management supplies a cost gradient. The charts and hands are scattered through that space to illustrate local adaptations, not measured locations of individual decisions in Figure 3.
The economic-side arrow shows the gradient toward cost efficiency; the workload-side arrow shows the gradient toward least effort. Both point toward the acceptable-performance side. Figure 3 and its adjacent discussion support these directions of migration. The arrow endpoints are illustrative rather than measured positions or fixed targets.
Everyone makes sensible choices. The business asks for cheaper and faster. People make work easier. Together, those pressures can move the dot toward the performance edge.
There is no magic safe spot in the middle. The lines do not push the dot back. Any line can move as demand, staffing, technology, or AI changes.
That is Rasmussen's warning: failure does not require one stupid decision. Normal adaptations can slowly move the system toward an edge nobody can see exactly.”
Core point: one current operating state moves within economic, workload, and acceptable-performance constraints; pressures move it, while sensing and control preserve margin and recoverability.
Sources
- https://doi.org/10.1016/S0925-7535(97)00052-0
- https://backend.orbit.dtu.dk/ws/files/158016663/SAFESCI.PDF (Figure 3 and its discussion of effort and cost gradients)
- https://srecon24.hatchman76.com/#/the-model
- https://qconsf.com/
Diagram Legend
Economic boundaryWhere money runs out
Workload boundaryWhere people cannot keep up
Performance boundaryWhere the system stops working acceptably
Error marginBuffer before the performance limit
Operating pointWhere the whole system is now
Playing surfaceRoom within the boundaries
Local Actions and External pressures Change the operating point or its constraints.
Economic Boundary Actions
Signals become decisions that push toward cost efficiency.
| Leading signal / metric | Possible management action |
|---|---|
Forecast cash burn increases |
Reduce scope, defer investment, reprioritize commitments |
Cost per verified outcome increases |
Renegotiate suppliers, rightsize resources, remove low-value work |
Idle capacity or unused licences |
Consolidate platforms, retire unused capacity |
Projected margin decreases |
Freeze hiring, reduce staffing or maintenance |
Cutting waste can reduce costs, but cutting expertise or maintenance can leave less room to operate safely.
Account for transferred work
Chapter 5 §5.2.4 (printed p. 81; supplied PDF p. 89) asks who receives a saving, who absorbs the work, and when it becomes visible. Track authoring savings beside reviewer, maintainer and on-call costs. Section 5.5.2 (printed p. 85; PDF p. 93) extends evaluation to future adaptability, coupling, congestion and conflict. A local saving is not sufficient evidence of a net workflow saving.
Financial feedback must reach people with authority, competence and resources to change commitments. They must communicate effects on review demand, maintenance and recovery across levels. Savings preserve other margins when low-value work is removed. If output stays fixed while expertise or review are cut, the resulting adaptations can transfer pressure into workload and acceptable performance.
- Rasmussen (1997), Figure 3; printed manuscript pp. 9–12, 15–18 and 27 (not journal pagination)
- Rayo, Morey, Grøtan and Woods (2026), AI Gold Rush 2 Versus AI Realism, Chapter 5
Workload Boundary
The sustainable capacity to do and understand the work can change.
More room to operate
- More trained people and relevant expertise
- Better tools and reliable toil reduction
- Protected focus, recovery time and knowledge sharing
Less room to operate
- Attrition, layoffs or unavailable specialists
- Fatigue, burnout and constant interruptions
- Fragile tooling and lost operational knowledge
Less capacity moves the boundary inward, more work can push the operating point toward it.
Focused verification capacity
Effective capacity means relevant expertise, focused time and enough context for this work, not merely assigned headcount. A reviewer can be allocated to many tasks yet lack usable time to assess this change. Protect contextual knowledge and recovery; changing demand or removing expert capacity can also change the verification effort required per item.
- Rasmussen (1997), Figures 1 and 3; control, adaptation and information
The Error Margin
Notice, act and recover before the functional limit is crossed.
| Signal / concern | Protective actions |
|---|---|
Blind spots or stale telemetry |
Improve monitoring, check user journeys, connect alerts to an owner who can act |
Saturation or shrinking headroom |
Improve software efficiency, load-test, add scalable capacity and tested redundancy |
Changes exceed verification capacity |
Limit admission, use canaries and rollback, retain independent review and access controls |
Slow or uncertain recovery |
Exercise failover and restore, update runbooks, practice diagnosis and share expertise |
Sustain adaptive capacity by turning signals into effective action
Notice, intervene and recover
Deliberate interventions pause or redirect work to preserve margin. Someone needs the evidence, authority and capacity to act.
Notice requires usable signals and timely interpretation. Intervention requires evidence, authority, tools and remaining response capacity. Recovery requires contextual knowledge and fallbacks that people can use under pressure. A written rollback procedure does not establish that capability. Awareness and the margin itself exert no automatic restoring force; the objective is sufficient margin, bounded excursions and recoverability, not a preferred geometric center.
Exercise stale observations, scarce time, excess review demand and unavailable supporting services outside production. Assess whether the team can pause, reduce scope and recover. Chapter 5 §§5.3.2–5.3.5 (printed pp. 82–84; PDF pp. 90–92) discusses difficulties recognizing plausible errors; §5.1 illustrates responsibility without resources and decay of alternatives; §§5.4–5.5 (printed pp. 84–86; PDF pp. 92–94) support challenging exercises and continuing assurance.
The AWS 19–20 October 2025 disruption report describes conventional automation and dependencies, with no reported generative AI involvement. Delayed DNS-plan application interacted with changed state and cleanup; subsequent EC2 recovery entered congestive collapse. AWS announced recovery testing and controls on incoming work. The report does not establish that all announced work was complete. Use it as a control-and-recovery mechanism example, not an AI-caused incident or a general verdict on automation.
- Rasmussen (1997), Figures 1 and 3; control, adaptation and information
- Rayo, Morey, Grøtan and Woods (2026), AI Gold Rush 2 Versus AI Realism, Chapter 5
- AWS, 19–20 October 2025 disruption: DynamoDB, EC2 and corrective actions
What happens as AI infiltrates every part of the system?
The operating point represents the whole socio-technical system's current state. The AI artwork is shorthand for AI-mediated work at that same state, not a second operating point, a person or a fourth constraint. The reference ball marks the starting state, not an ideal or inherently safe location.
Ask what changes in cost, effort, evidence and recovery when AI enters the work.
AI in the feedback and action channels
AI is not automatically a new controller. It influences channels used by existing controllers. On the feedback side it can gather and summarize observations, find contradictions and support testing; fluent summaries can also conceal uncertainty. On the action side it can present options, draft decisions and translate intent into output; plausible detail can exceed the communicator’s intended criteria.
AI output changes the operating state when people or automation admit and enact the resulting decisions, not merely when output is generated. The risk is conditional: AI can strengthen testing, diagnosis, challenge and verification. Risk rises when generation and action become easier faster than assurance and correction.
Rasmussen (1997) describes behaviour and work activity migrating toward the boundary. Cook and Rasmussen (2005) explicitly use operating-point terminology. The ball remains shorthand for one current whole-system state.
- Rasmussen (1997), Figures 1 and 3; control, adaptation and information
- Cook and Rasmussen (2005), Going solid
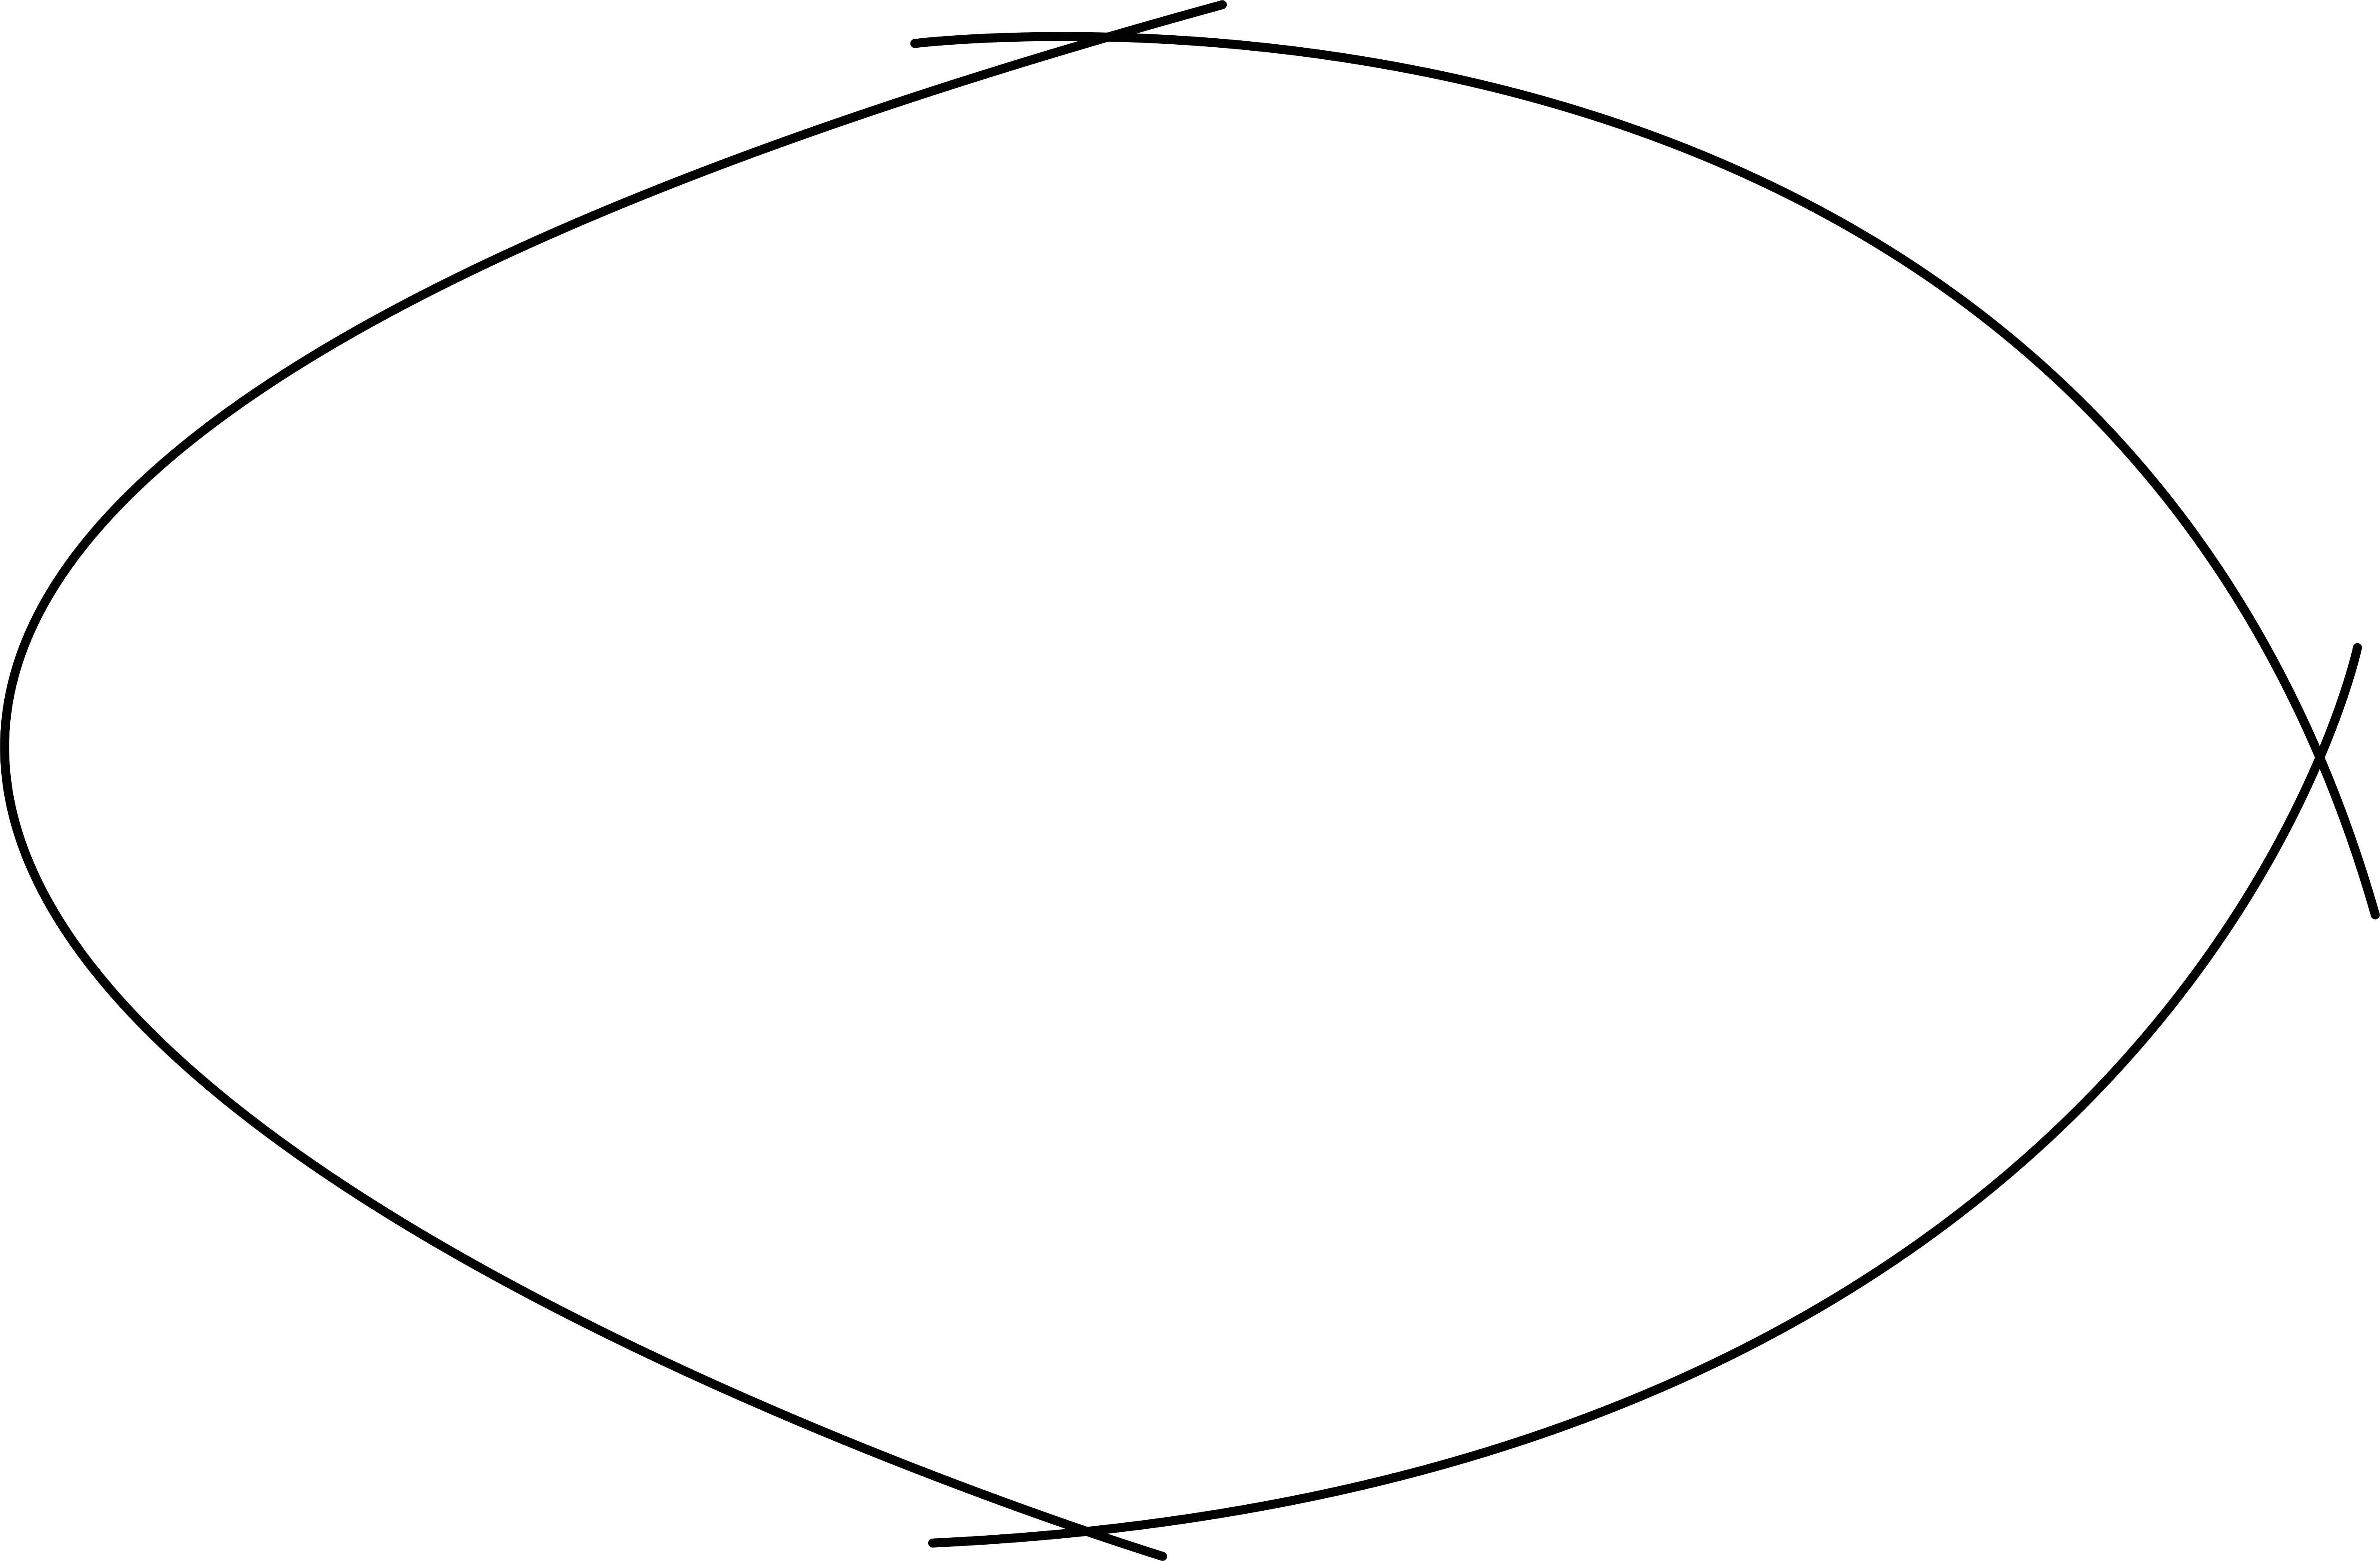
Boundary to economic failure
Boundary to unacceptable workload
Boundary of functionally acceptable performance
And work function and outputs rely heavily on non-determinism?
The same constraints still apply
Economic failure, unacceptable workload and functionally unacceptable performance remain the three constraints. The error margin is the protected performance-side buffer, not an additional constraint. AI does not create a fourth boundary.
The moving ball represents one current whole-system state. The reference ball marks the starting position, not a second current state or an ideal geometric centre.
The trajectory illustrates how adaptation under pressure can move the operating state toward the performance side. It is not a measured path. Organisational choices and usable feedback shape the actual trajectory, and no geometric centre guarantees safety.
Ask how non-deterministic outputs change what people can understand, verify and rely on. Examine the consequences for economics, workload, expertise and the capacity to intervene and recover.
AI and least effort
AI can make “generate, accept, act” the path of least effort.
Proxy the judgment
Pass off plausible AI reasoning as your own judgment.
Quick answers can hide a lack of understanding.

Multiply the streams
Agents generate more proposals, and humans inherit
review, integration and maintenance.

Squeeze recovery
Extra checking and context switching can
raise workload and burnout risk.
Evidence, capacity and understanding
Least effort describes normal adaptation under competing goals and limited attention, not a moral claim about laziness. Plausible ≠ measured. Fluent ≠ intended. Fast generation does not establish fast verification, integration or maintenance. Conflicting AI proposals still require people to reconstruct context and understand fundamentals. The meat-proxy scenario is this talk’s illustration, not a claim that all AI use reduces expertise. Chapter 5 §§5.3.1–5.3.4 (printed pp. 82–83; PDF pp. 90–91) discusses filtering, revision and plausible errors that need expertise to recognize and correct.
Current LLM evidence shows changes in task pace and cognitive effort that differ by task and experience. Lee et al. (CHI 2025) surveyed 319 knowledge workers: critical-thinking effort shifted toward verification, response integration and task stewardship, while higher confidence in AI was associated with less scrutiny. This is self-reported association, not causal proof. Dell’Acqua et al. randomized 758 consultants: work was faster and higher quality within the model’s capability frontier, but correctness was lower outside it. These are task-specific results, not a universal effect or a whole-system risk estimate. Dillon et al. and Brynjolfsson, Li and Raymond provide additional heterogeneous workplace evidence.
Preserve focused attention, contextual knowledge and usable authority to change commitments. Change scope, timing or admitted demand when checking cannot keep pace. AI can improve assurance capacity where joint evidence supports its testing and diagnosis. Demand relative to capacity can increase backlog and delay; defects additionally depend on adaptations that shed assurance. Do not treat generated backlog clearance as verified completion.
- Rayo, Morey, Grøtan and Woods (2026), AI Gold Rush 2 Versus AI Realism, Chapter 5
- Lee et al. (CHI 2025), The Impact of Generative AI on Critical Thinking
- Dell’Acqua et al., Navigating the Jagged Technological Frontier
- Dillon et al. (2025), Shifting Work Patterns with Generative AI
- Brynjolfsson, Li and Raymond (2025), Generative AI at Work
The erosion of expertise
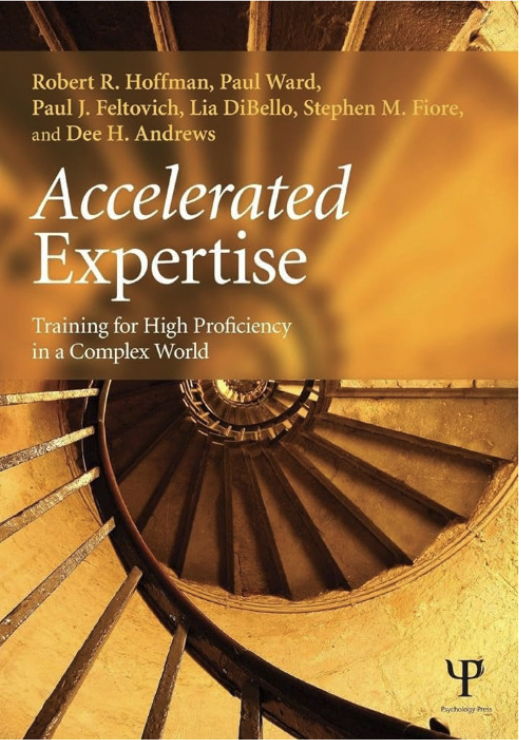
Accelerated Expertise.
Psychology Press.
“However, all of our lessons learned in cognitive systems engineering and complexity theory imply that more automation may result in simplifications, but they will hide deeper complexity, and at those moments where resilience and high-performance are needed, there will have to be greater operator expertise.”

Accelerated Expertise: Training for High Proficiency in a Complex World, by Robert R. Hoffman, Paul Ward, Paul J. Feltovich, Lia DiBello, Stephen M. Fiore and Dee H. Andrews.
Citation year and publisher follow the publisher's DOI record: 2013, Psychology Press, DOI 10.4324/9780203797327. The print edition carries a 2014 copyright year.
The supplied quotation is attributed to Accelerated Expertise. Use it to discuss how automation can simplify the surface of work while obscuring complexity that demands greater expertise when resilience and high performance are needed. This is a discussion of the risk to expertise, not a measured claim that all AI use erodes it.
Doctorow’s reverse-centaur distinction asks who controls the work: whether a person chooses how a machine assists them or is required to serve the machine’s pace and demands.
Cory Doctorow, The Reverse Centaur’s Guide to Life After AI (MCD, 2026): https://us.macmillan.com/books/9780374621568/thereversecentaursguidetolifeafterai/
Book-cover image supplied by Macmillan: https://mpd-biblio-covers.imgix.net/9780374621568.jpg

The people, shrugging, flame and “This is Fine” are a metaphor for uncertain understanding and unaddressed trouble in a complex system. The system remains complex even when the people responsible for it can no longer explain what is happening or how to intervene.
This is an illustration of a risk to expertise and control, not evidence that every use of AI causes expertise loss or failure.
Artwork credit: This is Fine by KC Green, animated by Philcrifo. Original comic: https://gunshowcomic.com/648. Animation credit: https://imgur.com/gallery/i-animated-this-is-fine-comic-tjxrc.
where we think we are

The buckets represent accumulating verification and repair work. The Lemming represents the expertise and response capacity needed to protect performance. Cheap generation can move checking, maintenance and recovery work elsewhere, consuming attention and capacity even as visible output increases.
The dotted line warns about the remaining buffer. Crossing it begins consuming protected error margin, while the solid line marks the actual functional limit. A warning helps only if people have practical understanding, time, authority and means to reduce demand, challenge output, stop further action or recover.
The faded reference marks where we think we are, while the moving point illustrates how actual conditions can drift. This is an illustrative possible journey, not a measured trajectory or claim that all AI output is workslop. Organisational choices and usable feedback shape whether people can detect and respond to a convincing mistake in their actual work.
GIF source: Toad Screaming, shared by BrendaMcCoy on Tenor.
Skills that protect margin
Systems understanding
Trace how AI shifts cost, workload and risk across the system.
Critical judgment
Challenge plausible output and test it against the real work.
Adaptation and recovery
Notice drift, revise mental models and act before margin runs out.

Learning Opportunities by Dr. Cat Hicks
Build expertise with guided exercises while coding with AI.
Expertise turns warnings into protective action.
Rasmussen directs attention to how locally reasonable decisions interact across the whole system. AI can change cost, effort and the pace of proposed action. Expertise helps people see those interactions, question plausible explanations and recognise when a plan no longer fits. Protecting margin requires useful feedback and the capacity to act on it. Crossing the dotted line begins consuming the protected buffer before the actual functional boundary. It does not establish that harm has already occurred.
Sources: Rasmussen (1997), Cook (2000), Hoffman et al. (2013), Woods (2018).
Learning Opportunities, by Dr. Cat Hicks, offers optional 10–15 minute exercises using prediction, explanation and reflection during AI-assisted coding. Use it to keep active learning in engineering work. GitHub repository.
We have to adapt
Economic: Count generation, verification, operation and switching costs.
Workload: Match AI output to the team’s ability to understand and check it.
Performance: Test the work, including plausible AI mistakes and recovery.
Error margin: Give people time, expertise and authority to turn signals into action.

Local savings can create pressure elsewhere.
The same three constraints remain: economic viability, acceptable workload and acceptable performance. AI can save effort in one place while moving verification, maintenance or recovery work elsewhere. Count the whole workflow and protect the people who interpret warning signals and own corrective action. Error margin is a protected performance-side buffer, not an SLO error budget or a fourth constraint. These proposed responses need local evidence and adjustment as conditions change.
Sources: Rasmussen (1997), Rayo et al. (2026), CMA (2025).
Homer side-eye GIF reused from the SREcon26 presentation: https://srecon26.hatchman76.com/images/homer-simpson-side-eye.gif
Humans are adaptable
Expertise, coordination and judgment help us respond when plans no longer fit.
Use AI to strengthen our capacity to understand, act and recover.
Adaptive capacity is developed before surprise and renewed through everyday work. Expertise, shared understanding and coordination help people change plans when familiar responses are no longer enough. They also need time, resources and authority to act. AI can contribute to that capacity when its use supports understanding and effective action. The aim is sustained joint performance and recoverability. This is the talk's application of resilience engineering, not a guarantee that humans or tools can absorb unlimited pressure.
Sources: Cook (2000), Allspaw (2019), Woods (2018), Hoffman et al. (2013).
Thank you!
https://qcon26.hatchman76.com
Socio Technical Systems
...in organizational development (Socio Technical Systems) is an approach to complex organizational work design that recognizes the interaction between people and technology in workplaces.
A socio-technical system cannot be understood by examining either people or technology in isolation.
The visual contrasts studying people and technology separately with seeing people as part of the system. Its connections emphasise the interactions between them.
This names the system the talk will examine and prepares Rasmussen’s control hierarchy.
People are part of control
People and organisations are adaptive components and controllers within the socio-technical system, not an external human input. Locally sensible adaptations can preserve control, or interact to create conditions for failure. Rasmussen connects effective control with usable objectives, feedback, competence, coordination and commitment.
Source: Rasmussen (1997), Figures 1 and 3, control, adaptation and information.